Week 3: Dealing with Data
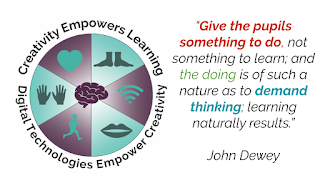
Today we looked into the 'Create' part of Manaikalini's pedagogy of 'learn, create, share.' Create - is a doing word, it involves the whole body. The experiences where children get to create are the ones that they remember. The use of devices can enable creativity to take place and in return engage students in the thinking involved in the task. Allowing children to be creative can be empowering when they are given choices, information, skills, and scaffolding.
As a part of exploring 'create' this morning the 6 C's were brought to our attention. I really resonate with these. As an educator I feel that these are essential skills for children to develop in order for them to become successful members within our society. As we approach our midyear reporting I plan to look at and comment on these skills and how children are developing/working towards these.
Google Forms - I am now inspired to use this as a tool for checking children's knowledge on various topics. I also want to try using forms as a reflective tool. We set time aside each week for the children to write in a reflective journal. They find this very boring and often write the same thing each week. My hope is that by making this digital it will encourage them to engage more during this time.
My Maps was a cool new tool we were introduced to today. It allows you to map locations specific to you or for a specific task. I was able to map out locations I would like to visit and then layered this with places that I have already visited. This could be used for different learning experiences in the classroom:
- Beginning of the year (Where do we all come from?)
- Topic (Where are there endangered animals in the world?)
- Informative Writing (Mapping where you can find specific animals)
Today we explored Google Sheets as a tool. In the past I have only ever used sheets as a planning template, after discovering it last year. I now realise that there is a lot more that can be done on it especially when it comes to analysing data. If I am honest I am not confident enough with using this tool that I would use it with my students. It is something I will continue to play around and experiment with before I think about introducing it to my students.
After learning how to use Google Sheets we were asked to analyse a student's blog post After entering the required data (including the year, and the amount of posts made) we highlighted the data and made it into a chart. The chart can then be customised to your liking.


Comments
Post a Comment
To support my learning I ask you to comment as follows:
1. Something positive - Begin with a greeting. Talk about something you like about what I have shared.
2. Thoughtful - A comment that will mean something to me to let me know you read/watched or listened to what I had to say. - use any language.
3. Something helpful - Give me some ideas for next time or ask me a question.
Encourage me to make another post